

NEW YORK , May 17, 2022 /PRNewswire/ — Technavio categorizes the global sports and fitness wear market as a part of the global apparel, accessories, and luxury goods market. The sports and fitness wear market research report provides valuable insights on the post-COVID-19 impact on the market, which will help companies evaluate their business approaches.
Sports and Fitness Wear Market: Key Driver
The increase in the number of sports tournaments is driving the sports and fitness wear market growth. The sports industry has witnessed an upsurge in the number of tournaments due to the growing interest of people globally in sports activities, which can increase the sales of sports and fitness wear. For instance, the increase in the number of registered baseball players has led to an increase in the number of baseball and softball tournaments and matches.
View market report outlook to learn more about factors influencing the market.
Sports and Fitness Wear Market: Key Challenges
Volatile raw material prices hinder the sports and fitness wear market growth. The key vendors, including adidas, Nike, and PUMA, are witnessing fluctuations in their profit margins due to the fluctuating prices of raw materials and the increase in competition among the vendors in the market. As the establishment costs are low, there is an increase in the influx of local vendors. The emergence of local vendors leads to price wars among market competitors. Such factors compel the vendors to decrease the prices of their products, which, in turn, affect their profit margins.
Vendor Insights
The report identifies the following as the dominant vendors in the market:
Product Insights and News
The sports and fitness wear market forecast report offers in-depth insights into key vendor profiles. The profiles include information on the production, sustainability, and prospects of the leading companies. For instance, Chem Trend LP, a leading vendor, offers various products such as casting lubricants, release agents, tire manufacturing aids, purge compounds, and ancillary products. The company also offers a mold release coating that helps to minimize mold fouling, aids rubber flow, assists in the release of the tire from the mold at the end of the cure cycle, and enhances the finished tire appearance.
Learn more about the vendors in the market as you download your sample copy
APAC’s Contribution to Sports and Fitness Wear Market
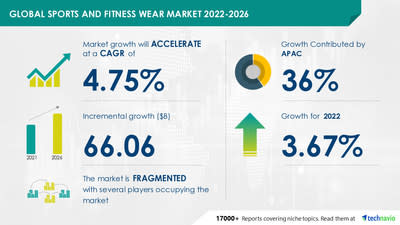
The increase in the participation of people in regular fitness and sports activities is expected to propel the sports and fitness wear market growth in APAC. Countries such as China and Japan are expected to be the main contributors to market growth in the region. APAC is expected to contribute 36% of the sports and fitness wear market growth. Market growth in the region is expected to be higher than the growth of the market in other regions.
Download your sample copy and know more about the market contribution in APAC
|
Sports and Fitness Wear Market Scope |
|
|
Report Coverage |
Details |
|
Page number |
120 |
|
Base year |
2021 |
|
Forecast period |
2022-2026 |
|
Growth momentum & CAGR |
Accelerate at a CAGR of 4.75% |
|
Market growth 2022-2026 |
$ 66.06 billion |
|
Market structure |
Fragmented |
|
YoY growth (%) |
3.67 |
|
Regional analysis |
North America, APAC, Europe, South America, and Middle East and Africa |
|
Performing market contribution |
APAC at 36% |
|
Key consumer countries |
US, China, Japan, Germany, and the UK |
|
Competitive landscape |
Leading companies, Competitive strategies, Consumer engagement scope |
|
Key companies profiled |
adidas AG, ASICS Corp., Brooks Sports Inc., Columbia Sportswear Co., Deckers Outdoor Corp., Kappa, Karhu Holding BV, Li Ning Co. Ltd., lululemon athletica Inc., Mizuno Corp., New Balance Athletics Inc., Nike Inc., Patagonia Inc., PUMA SE, Ralph Lauren Corp., Skechers USA Inc., The Gap Inc., Under Armour Inc., VF Corp., and Wolverine World Wide Inc. |
|
Market dynamics |
Parent market analysis, Market growth inducers and obstacles, Fast-growing and slow-growing segment analysis, COVID 19 impact and recovery analysis and future consumer dynamics, Market condition analysis for the forecast period |
|
Customization purview |
If our report has not included the data that you are looking for, you can reach out to our analysts and get segments customized. |
Get your report sample copy to unlock scope and parent market analysis insights
Market Segmentation
The sports and fitness market is divided by end-user into men and women segments. The women segment is expected to significantly contribute to the sports and fitness wear market. The increase in the population of working women, increase in demand from developing countries, and recovery from the recession are some of the factors driving the segment. The rise in participation of women in sports and fitness activities has bridged the gap between male and female participation ratio and increased the per-unit sales of sports and fitness wear. Moreover, women are more fashion-conscious than men, which forces key competitors to upgrade their product lines with new designs and styles to add more women consumers.
Key Highlights
-
Accurate predictions on upcoming trends and changes in consumer behavior
-
A thorough analysis of the market’s competitive landscape and detailed information on vendors
-
CAGR of the market during the forecast period 2022-2026
-
Detailed information on factors that will drive sports and fitness wear market growth during the next five years
-
The growth of the sports and fitness wear industry across North America, APAC, Europe, South America, and the Middle East and Africa
-
Precise estimation of the sports and fitness wear market size and its contribution to the parent market
Related Reports:
Swimwear Market by Application, Distribution Channel, and Geography – Forecast and Analysis 2022-2026 Download your sample
Skating Shoes Market by Type and Geography – Forecast and Analysis 2022-2026 Download your sample
Table of Contents
1. Executive Summary
2. Market Landscape
2.1 Market ecosystem
Exhibit 01: Parent market
2.2: Market Characteristics
3. Market Sizing
3.1 Market definition
Exhibit 02: Offerings of vendors included in the market definition
3.2 Market segment analysis
Exhibit 03: Market segments
3.3 Market size 2020
3.4 Market outlook: Forecast for 2020 – 2025
Exhibit 04: Chart on Global – Market size and forecast 2021-2026 ($ billion)
Exhibit 05: Data Table on Global – Market size and forecast 2021-2026 ($ billion)
Exhibit 06: Chart on Global Market: Year-over-year growth 2021-2026 (%)
Exhibit 07: Data Table on Global Market: Year-over-year growth 2021-2026 (%)
4. Five Forces Analysis
4.1 Five Forces Summary
Exhibit 08: Five forces analysis 2020 & 2025
4.2 Bargaining power of buyers
4.3 Bargaining power of suppliers
4.4 Threat of new entrants
4.5 Threat of substitutes
4.6 Threat of rivalry
4.7 Market condition
Exhibit 09: Chart on Market condition – Five forces 2021 and 2026
5 Market Segmentation by End-user
5.1 Market segments
The segments covered in this chapter are Women and Men.
Exhibit 10: Chart on End-user – Market share 2021-2026 (%)
Exhibit 11: Data Table on End-user – Market share 2021-2026 (%)
5.2 Comparison by End-user
Exhibit 12: Chart on Comparison by End-user
5.3 Women – Market size and forecast 2021-2026
Exhibit 13: Chart on Women – Market size and forecast 2021-2026 ($ billion)
Exhibit 14: Data Table on Women – Market size and forecast 2021-2026 ($ billion)
Exhibit 15: Chart on Women – Year-over-year growth 2021-2026 (%)
Exhibit 16: Data Table on Women – Year-over-year growth 2021-2026 (%)
5.4 Men – Market size and forecast 2021-2026
Exhibit 17: Chart on Men – Market size and forecast 2021-2026 ($ billion)
Exhibit 18: Data Table on Men – Market size and forecast 2021-2026 ($ billion)
Exhibit 19: Chart on Men – Year-over-year growth 2021-2026 (%)
Exhibit 20: Data Table on Men – Year-over-year growth 2021-2026 (%)
5.5 Market opportunity by End-user
Exhibit 21: Market opportunity by End-user ($ billion)
6 Market Segmentation by Product
6.1 Market segments
The segments covered in this chapter are Top wear, Bottom wear, and Support items.
Exhibit 22: Chart on Product – Market share 2021-2026 (%)
Exhibit 23: Data Table on Product – Market share 2021-2026 (%)
6.2 Comparison by Product
Exhibit 24: Chart on Comparison by Product
Exhibit 25: Data Table on Comparison by Product
6.3 Top wear – Market size and forecast 2021-2026
Exhibit 26: Chart on Top wear – Market size and forecast 2021-2026 ($ billion)
Exhibit 27: Data Table on Top wear – Market size and forecast 2021-2026 ($ billion)
Exhibit 28: Chart on Top wear – Year-over-year growth 2021-2026 (%)
Exhibit 29: Data Table on Top wear – Year-over-year growth 2021-2026 (%)
Exhibit 30: Chart on Bottom wear – Market size and forecast 2021-2026 ($ billion)
Exhibit 31: Data Table on Bottom wear – Market size and forecast 2021-2026 ($ billion)
Exhibit 32: Chart on Bottom wear – Year-over-year growth 2021-2026 (%)
Exhibit 33: Data Table on Bottom wear – Year-over-year growth 2021-2026 (%)
6.4 Support items – Market size and forecast 2021-2026
Exhibit 34: Chart on Support items – Market size and forecast 2021-2026 ($ billion)
Exhibit 35: Data Table on Support items – Market size and forecast 2021-2026 ($ billion)
Exhibit 36: Chart on Support items – Year-over-year growth 2021-2026 (%)
Exhibit 37: Data Table on Support items – Year-over-year growth 2021-2026 (%)
6.5 Market opportunity by Product
Exhibit 38: Market opportunity by Product ($ billion)
7 Market Segmentation by Application
7.1 Market segments
The segments covered in this chapter are Outdoor, Sports-inspired, and Performance.
Exhibit 39: Chart on Application – Market share 2021-2026 (%)
Exhibit 40: Data Table on Application – Market share 2021-2026 (%)
7.2 Comparison by Application
Exhibit 41: Chart on Comparison by Application
Exhibit 42: Data Table on Comparison by Application
7.3 Outdoor – Market size and forecast 2021-2026
Exhibit 43: Chart on Outdoor – Market size and forecast 2021-2026 ($ billion)
Exhibit 44: Data Table on Outdoor – Market size and forecast 2021-2026 ($ billion)
Exhibit 45: Chart on Outdoor – Year-over-year growth 2021-2026 (%)
Exhibit 46: Data Table on Outdoor – Year-over-year growth 2021-2026 (%)
7.4 Sports-inspired – Market size and forecast 2021-2026
Exhibit 47: Chart on Sports-inspired – Market size and forecast 2021-2026 ($ billion)
Exhibit 48: Data Table on Sports-inspired – Market size and forecast 2021-2026 ($ billion)
Exhibit 49: Chart on Sports-inspired – Year-over-year growth 2021-2026 (%)
Exhibit 50: Data Table on Sports-inspired – Year-over-year growth 2021-2026 (%)
7.5 Performance – Market size and forecast 2021-2026
Exhibit 51: Chart on Performance – Market size and forecast 2021-2026 ($ billion)
Exhibit 52: Data Table on Performance – Market size and forecast 2021-2026 ($ billion)
Exhibit 53: Chart on Performance – Year-over-year growth 2021-2026 (%)
Exhibit 54: Data Table on Performance – Year-over-year growth 2021-2026 (%)
Exhibit 55: Market opportunity by Application ($ billion)
8 Customer Landscape
8.1 Customer landscape overview
Exhibit 56: Analysis of price sensitivity, lifecycle, customer purchase basket, adoption rates, and purchase criteria
9 Geographic Landscape
9.1 Geographic segmentation
Exhibit 57: Chart on Market share by geography 2021-2026 (%)
Exhibit 58: Data Table on Market share by geography 2021-2026 (%)
9.2 Geographic comparison
Exhibit 59: Chart on Geographic comparison
Exhibit 60: Data Table on Geographic comparison
9.3 North America – Market size and forecast 2021-2026
Exhibit 61: Chart on North America – Market size and forecast 2021-2026 ($ billion)
Exhibit 62: Data Table on North America – Market size and forecast 2021-2026 ($ billion)
9.4 North America – Market size and forecast 2021-2026
Exhibit 63: Chart on North America – Market size and forecast 2021-2026 ($ billion)
Exhibit 64: Data Table on North America – Market size and forecast 2021-2026 ($ billion)
Exhibit 65: Chart on North America – Year-over-year growth 2021-2026 (%)
Exhibit 66: Data Table on North America – Year-over-year growth 2021-2026 (%)
9.5 APAC – Market size and forecast 2021-2026
Exhibit 67: Chart on APAC – Market size and forecast 2021-2026 ($ billion)
Exhibit 68: Data Table on APAC – Market size and forecast 2021-2026 ($ billion)
Exhibit 69: Chart on APAC – Year-over-year growth 2021-2026 (%)
Exhibit 70: Data Table on APAC – Year-over-year growth 2021-2026 (%)
9.6 Europe – Market size and forecast 2021-2026
Exhibit 71: Chart on Europe – Market size and forecast 2021-2026 ($ billion)
Exhibit 72: Data Table on Europe – Market size and forecast 2021-2026 ($ billion)
Exhibit 73: Chart on Europe – Year-over-year growth 2021-2026 (%)
Exhibit 74: Data Table on Europe – Year-over-year growth 2021-2026 (%)
9.7 South America – Market size and forecast 2021-2026
Exhibit 75: Chart on South America – Market size and forecast 2021-2026 ($ billion)
Exhibit 76: Data Table on South America – Market size and forecast 2021-2026 ($ billion)
Exhibit 77: Chart on South America – Year-over-year growth 2021-2026 (%)
Exhibit 78: Data Table on South America – Year-over-year growth 2021-2026 (%)
9.8 Middle East and Africa – Market size and forecast 2021-2026
Exhibit 79: Chart on Middle East and Africa – Market size and forecast 2021-2026 ($ billion)
Exhibit 80: Data Table on Middle East and Africa – Market size and forecast 2021-2026 ($ billion)
Exhibit 81: Chart on Middle East and Africa – Year-over-year growth 2021-2026 (%)
Exhibit 82: Data Table on Middle East and Africa – Year-over-year growth 2021-2026 (%)
9.9 US – Market size and forecast 2021-2026
Exhibit 83: Chart on US – Market size and forecast 2021-2026 ($ billion)
Exhibit 84: Data Table on US – Market size and forecast 2021-2026 ($ billion)
Exhibit 85: Chart on US – Year-over-year growth 2021-2026 (%)
Exhibit 86: Data Table on US – Year-over-year growth 2021-2026 (%)
9.10 China – Market size and forecast 2021-2026
Exhibit 87: Chart on China – Market size and forecast 2021-2026 ($ billion)
Exhibit 88: Data Table on China – Market size and forecast 2021-2026 ($ billion
Exhibit 89: Chart on China – Year-over-year growth 2021-2026 (%)
Exhibit 90: Data Table on China – Year-over-year growth 2021-2026 (%)
9.11 Germany – Market size and forecast 2021-2026
Exhibit 91: Chart on Germany – Market size and forecast 2021-2026 ($ billion)
Exhibit 92: Data Table on Germany – Market size and forecast 2021-2026 ($ billion)
Exhibit 93: Chart on Germany – Year-over-year growth 2021-2026 (%)
Exhibit 94: Data Table on Germany – Year-over-year growth 2021-2026 (%)
9.12 UK – Market size and forecast 2021-2026
Exhibit 95: Chart on UK – Market size and forecast 2021-2026 ($ billion)
Exhibit 96: Data Table on UK – Market size and forecast 2021-2026 ($ billion)
Exhibit 97: Chart on UK – Year-over-year growth 2021-2026 (%)
Exhibit 98: Data Table on UK – Year-over-year growth 2021-2026 (%)
9.13 Japan – Market size and forecast 2021-2026
Exhibit 99: Chart on Japan – Market size and forecast 2021-2026 ($ billion)
Exhibit 100: Data Table on Japan – Market size and forecast 2021-2026 ($ billion)
Exhibit 101: Chart on Japan – Year-over-year growth 2021-2026 (%)
Exhibit 102: Data Table on Japan – Year-over-year growth 2021-2026 (%)
9.14 Market opportunity by geography
Exhibit 103: Market opportunity by geography ($ billion)
10 Drivers, Challenges, and Trends
10.1 Market drivers
10.1.1 Rising number of sports tournaments
10.1.2 Increasing interest in physical fitness activities due to several health benefits
10.1.3 Product premiumization due to the introduction of more innovative sports and fitness wear
10.2 Market challenges
10.2.1 Volatile raw material prices
10.2.2 Increasing pressure on market competitors for involving category sustainability
10.2.3 Growing popularity of anti-sweatshop movement campaigns
Exhibit 104: Impact of drivers and challenges in 2021 and 2026
10.3 Market trends
10.4.1 Technological advances in sports and fitness wear
10.4.2 Growth in the number and membership of health and fitness clubs
10.4.3 Advent of customized and personalized sports and fitness wear
11. Vendor Landscape
11.1 Competitive scenario
11.2 Vendor landscape
Exhibit 105: Vendor Landscape
11.3 Landscape disruption
Exhibit 106: Landscape disruption
11.4 Industry risks
Exhibit 107: Industry risks
12. Vendor Analysis
12.1 Vendors covered
Exhibit 108: Vendors covered
12.2 Market positioning of vendors
Exhibit 109: Matrix on vendor position and classification
12.3 adidas AG
Exhibit 110: adidas AG – Overview
Exhibit 111: adidas AG – Business segments
Exhibit 112: adidas AG – Key news
Exhibit 113: adidas AG – Key offerings
Exhibit 114: adidas AG – Segment focus
12.4 ASICS Corp.
Exhibit 115: ASICS Corp. – Overview
Exhibit 116: ASICS Corp. – Business segments
Exhibit 117: ASICS Corp. – Key news
Exhibit 118: ASICS Corp. – Key offerings
Exhibit 119: ASICS Corp. – Segment focus
12.5 Brooks Sports Inc.
Exhibit 120: Brooks Sports Inc. – Overview
Exhibit 121: Brooks Sports Inc. – Product / Service
Exhibit 122: Brooks Sports Inc. – Key offerings
About Us
Technavio is a leading global technology research and advisory company. Their research and analysis focus on emerging market trends and provide actionable insights to help businesses identify market opportunities and develop effective strategies to optimize their market positions. With over 500 specialized analysts, Technavio’s report library and its client base consist of enterprises of all sizes, including more than 100 Fortune 500 companies. This growing client base relies on Technavio’s comprehensive coverage, extensive research, and actionable market insights to identify opportunities in existing and potential markets and assess their competitive positions within changing market scenarios.
Contact
Technavio Research
Jesse Maida
Media & Marketing Executive
US: +1 844 364 1100
UK: +44 203 893 3200
Email:media@technavio.com
Website: www.technavio.com/


View original content to download multimedia:https://www.prnewswire.com/news-releases/sports-and-fitness-wear-market-apac-to-contribute-to-36-market-growth-technavio-301547841.html
SOURCE Technavio


